| Table | Best for |
|---|---|
knitr::kble()/{kableExtra} |
PDF/LaTeX. (Also quick ’n dirty) |
| {flextable} | Word/PowerPoint |
| {gt} | HTML reports |
| {reactable} | Interactive HTML dashboards/Shiny apps |
| {DT} | Quick interactive exploration (Shiny or standalone) |
| What else am I missing? | {huxtable}? {tinytable}? |
Great Tables with gt
How to use gt
gt
tables
Experimenting with gt package to learn basics plus advanced features.
Goal
The {gt} package has so many functions that it can feel overwhelming. This notebook establishes a baseline foundation to create 80% of what you would normally need, and enough conceptual understanding to guess what’s possible and where to look.
Background
There’s no best package, just the best for your situation.
Setup
The package comes with several sample datasets. We’ll use gtcars, a dataset of high-en sports cars, because it has a mix of numeric and categorical columns.
library(tidyverse)
library(gt)

gt_cars_sample <- gt::gtcars |>
  filter(mfr %in% c("Lamborghini", "BMW")) |>
  select(mfr, model, year, hp, mpg_c, mpg_h)

dplyr::glimpse(gt_cars_sample)
Rows: 8
Columns: 6
$ mfr <chr> "Lamborghini", "Lamborghini", "Lamborghini", "BMW", "BMW", "BMW"…
$ model <chr> "Aventador", "Huracan", "Gallardo", "6-Series", "i8", "M4", "M5"…
$ year <dbl> 2015, 2015, 2014, 2016, 2016, 2016, 2016, 2016
$ hp <dbl> 700, 610, 550, 315, 357, 425, 560, 560
$ mpg_c <dbl> 11, 16, 12, 20, 28, 17, 15, 15
$ mpg_h <dbl> 18, 20, 20, 30, 29, 24, 22, 22Build Up a Table
Let’s build up a {gt} table from scratch. Here is a reference schematic from the gt website:
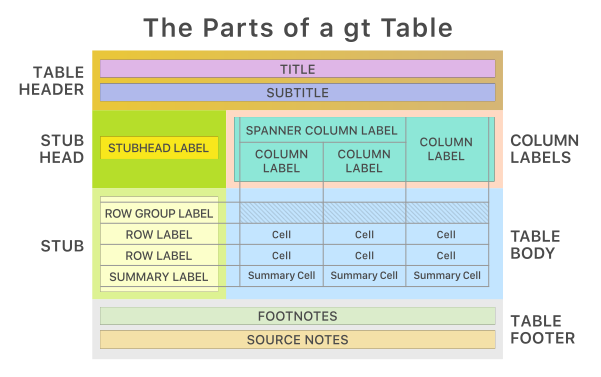
The first thing to notice is that the object has a table body and column labels. It can potentially have a stub (row groups or labels), header, and footer.
This is analogous to the {ggplot} object. “gt” stands for “grammar of tables”, and just like {ggplot} layers build from a base, {gt} functions pipe together to add structure and styling.
1. The Basic Table
gt() converts a data frame into a gt_tbl object. That’s all you need, but you can optionally add tab_header(), cols_label(), tab_stubhead(), and tab_sourcenote().
Show the code
tbl_1 <- gt_cars_sample |>
  gt::gt(rowname_col = "mfr") |>
  gt::tab_header(
    title = "Basic Table",
    subtitle = "with stub, column labels, header, and footer."
  ) |>
  gt::cols_label(
    model = "Model",
    year = "Year",
    hp = "Horsepower",
    mpg_c = "MPG - City",
    mpg_h = "MPG - Hwy"
  ) |>
  gt::tab_stubhead("Manufacturer") |>
  gt::tab_source_note("Source: gtcars is from the gt package.")

tbl_1| Basic Table | |||||
|---|---|---|---|---|---|
| with stub, column labels, header, and footer. | |||||
| Manufacturer | Model | Year | Horsepower | MPG - City | MPG - Hwy |
| Lamborghini | Aventador | 2015 | 700 | 11 | 18 |
| Lamborghini | Huracan | 2015 | 610 | 16 | 20 |
| Lamborghini | Gallardo | 2014 | 550 | 12 | 20 |
| BMW | 6-Series | 2016 | 315 | 20 | 30 |
| BMW | i8 | 2016 | 357 | 28 | 29 |
| BMW | M4 | 2016 | 425 | 17 | 24 |
| BMW | M5 | 2016 | 560 | 15 | 22 |
| BMW | M6 | 2016 | 560 | 15 | 22 |
| Source: gtcars is from the gt package. | |||||
2. Footnotes
You can add footnotes almost anywhere on the table. Base command is tab_footnote(footnote, locations) where locations is a function related to a part of the table:
cells_body()cells_column_labels()cells_column_spanners()cells_grand_summary()cells_group()cells_row_groups()cells_source_notes()cells_stub()cells_stub_grand_summary()cells_stub_summary()cells_stubhead()cells_title()
Show the code
tbl_2 <- tbl_1 |>
  gt::tab_footnote(
    "gt Cars is gtcars in gt.",
    locations = gt::cells_title(groups = "title")
  ) |>
  gt::tab_footnote(
    "Horsepower over 600 is a strong vehicle.",
    locations = gt::cells_column_labels(columns = hp)
  ) |>
  # Footnote in table body. `rows` uses a formula.
  gt::tab_footnote(
    "Fuel efficient!",
    locations = gt::cells_body(
      columns = mpg_h,
      rows = mpg_h > 20
    ),
    placement = "right" # puts the marker on the right side of the cell
  ) |>
  gt::tab_header(
    title = "Footnotes",
    subtitle = gt::md(
      "In header (`cells_title()`), <br>column labels (`cells_column_labels()`), and <br>body(`cells_body()`)"
    )
  )

tbl_2| Footnotes1 | |||||
|---|---|---|---|---|---|
In header (cells_title()), column labels ( cells_column_labels()), and body( cells_body()) |
|||||
| Manufacturer | Model | Year | Horsepower2 | MPG - City | MPG - Hwy |
| Lamborghini | Aventador | 2015 | 700 | 11 | 18 |
| Lamborghini | Huracan | 2015 | 610 | 16 | 20 |
| Lamborghini | Gallardo | 2014 | 550 | 12 | 20 |
| BMW | 6-Series | 2016 | 315 | 20 | 303 |
| BMW | i8 | 2016 | 357 | 28 | 293 |
| BMW | M4 | 2016 | 425 | 17 | 243 |
| BMW | M5 | 2016 | 560 | 15 | 223 |
| BMW | M6 | 2016 | 560 | 15 | 223 |
| 1 gt Cars is gtcars in gt. | |||||
| 2 Horsepower over 600 is a strong vehicle. | |||||
| 3 Fuel efficient! | |||||
| Source: gtcars is from the gt package. | |||||
3. Formatting
tab_options() is the {gt} equivalent of ggplot2::theme(). To format specific cells, use tab_tyle(style, locations) where style is a function related to a styling type:
cell_text()cell_fill()cell_borders()
Show the code
tbl_3 <- tbl_2 |>
  # TABLE DEFAULTS
  gt::tab_options(
    heading.align = "left",
    table.font.size = gt::pct(90)
  ) |>
  # SPECIFIC CELLS
  gt::tab_style(
    style = gt::cell_fill("gray90", alpha = .5),
    locations = gt::cells_column_labels(
      columns = c(model, year, hp, mpg_c, mpg_h)
    )
  ) |>
  gt::tab_header(
    title = "Formatting",
    subtitle = gt::md("with `tab_options()` and `tab_style()`.")
  )

tbl_3| Formatting1 | |||||
|---|---|---|---|---|---|
with tab_options() and tab_style(). |
|||||
| Manufacturer | Model | Year | Horsepower2 | MPG - City | MPG - Hwy |
| Lamborghini | Aventador | 2015 | 700 | 11 | 18 |
| Lamborghini | Huracan | 2015 | 610 | 16 | 20 |
| Lamborghini | Gallardo | 2014 | 550 | 12 | 20 |
| BMW | 6-Series | 2016 | 315 | 20 | 303 |
| BMW | i8 | 2016 | 357 | 28 | 293 |
| BMW | M4 | 2016 | 425 | 17 | 243 |
| BMW | M5 | 2016 | 560 | 15 | 223 |
| BMW | M6 | 2016 | 560 | 15 | 223 |
| 1 gt Cars is gtcars in gt. | |||||
| 2 Horsepower over 600 is a strong vehicle. | |||||
| 3 Fuel efficient! | |||||
| Source: gtcars is from the gt package. | |||||
4. Spanners and Groups
Column spanners group related columns together under a shared label (useful for organizing related metrics). Row groups organize rows by category.
Spanners
Show the code
tbl_4 <- tbl_3 |>
  gt::tab_spanner(
    label = "Miles per Gallon",
    columns = mpg_c:mpg_h
  ) |>
  # ALREADY CALLED THIS, BUT YOU CAN OVERRIDE THE PRIOR SETTING
  gt::cols_label(
    mpg_c = "City",
    mpg_h = "Hwy"
  ) |>
  gt::tab_style(
    style = gt::cell_fill("gray95"),
    locations = gt::cells_column_spanners()
  ) |>
  gt::tab_header(
    title = "Column Spanners",
    subtitle = "with `tab_spanner()`"
  )

tbl_4| Column Spanners1 | |||||
|---|---|---|---|---|---|
| with `tab_spanner()` | |||||
| Manufacturer | Model | Year | Horsepower2 |
Miles per Gallon
|
|
| City | Hwy | ||||
| Lamborghini | Aventador | 2015 | 700 | 11 | 18 |
| Lamborghini | Huracan | 2015 | 610 | 16 | 20 |
| Lamborghini | Gallardo | 2014 | 550 | 12 | 20 |
| BMW | 6-Series | 2016 | 315 | 20 | 303 |
| BMW | i8 | 2016 | 357 | 28 | 293 |
| BMW | M4 | 2016 | 425 | 17 | 243 |
| BMW | M5 | 2016 | 560 | 15 | 223 |
| BMW | M6 | 2016 | 560 | 15 | 223 |
| 1 gt Cars is gtcars in gt. | |||||
| 2 Horsepower over 600 is a strong vehicle. | |||||
| 3 Fuel efficient! | |||||
| Source: gtcars is from the gt package. | |||||
Groups
Unlike previous examples, row groups are specified in the base gt() call, so we start fresh here.
Show the code
gt_cars_sample |>
  gt::gt(groupname_col = "mfr", rowname_col = "model") |>
  gt::tab_header(
    title = "Row Groups Stacked",
    subtitle = "Groups are separated with headers."
  ) |>
gt::tab_options(row_group.background.color = "gray95")| Row Groups Stacked | ||||
|---|---|---|---|---|
| Groups are separated with headers. | ||||
| year | hp | mpg_c | mpg_h | |
| Lamborghini | ||||
| Aventador | 2015 | 700 | 11 | 18 |
| Huracan | 2015 | 610 | 16 | 20 |
| Gallardo | 2014 | 550 | 12 | 20 |
| BMW | ||||
| 6-Series | 2016 | 315 | 20 | 30 |
| i8 | 2016 | 357 | 28 | 29 |
| M4 | 2016 | 425 | 17 | 24 |
| M5 | 2016 | 560 | 15 | 22 |
| M6 | 2016 | 560 | 15 | 22 |
Show the code
gt_cars_sample |>
  gt::gt(
    groupname_col = "mfr",
    rowname_col = "model",
    row_group_as_column = TRUE
  ) |>
  gt::tab_header(
    title = "Row Groups as a Column",
    subtitle = "Groups are inline using `row_group_as_column = TRUE`."
  ) |>
gt::tab_options(row_group.background.color = "gray95")| Row Groups as a Column | |||||
|---|---|---|---|---|---|
| Groups are inline using `row_group_as_column = TRUE`. | |||||
| year | hp | mpg_c | mpg_h | ||
| Lamborghini | Aventador | 2015 | 700 | 11 | 18 |
| Huracan | 2015 | 610 | 16 | 20 | |
| Gallardo | 2014 | 550 | 12 | 20 | |
| BMW | 6-Series | 2016 | 315 | 20 | 30 |
| i8 | 2016 | 357 | 28 | 29 | |
| M4 | 2016 | 425 | 17 | 24 | |
| M5 | 2016 | 560 | 15 | 22 | |
| M6 | 2016 | 560 | 15 | 22 | |
Some of What’s Possible
At this point, we’ve covered 80% of what you’d normally need. {gt} can do far more than what we’ve covered, so let’s explore some of the possibilities. Here’s a quick gallery of advanced techniques. You don’t need to master these (at least, I haven’t!), but if a use case arises, between the docs and Copilot, you’ll figure it out.
Show the code
tbl_4 |>
  gt::tab_source_note(
    gt::md("**Source**:`gtcars` is from the **{gt}** package.")
  ) |>
  gt::cols_label(hp = gt::html("Hourse<br>Power")) |>
  gt::tab_header(
    title = "Treat Text as Markdown or HTML",
    subtitle = gt::md("with `md()` and `html()`")
)| Treat Text as Markdown or HTML1 | |||||
|---|---|---|---|---|---|
with md() and html() |
|||||
| Manufacturer | Model | Year | Hourse Power2 |
Miles per Gallon
|
|
| City | Hwy | ||||
| Lamborghini | Aventador | 2015 | 700 | 11 | 18 |
| Lamborghini | Huracan | 2015 | 610 | 16 | 20 |
| Lamborghini | Gallardo | 2014 | 550 | 12 | 20 |
| BMW | 6-Series | 2016 | 315 | 20 | 303 |
| BMW | i8 | 2016 | 357 | 28 | 293 |
| BMW | M4 | 2016 | 425 | 17 | 243 |
| BMW | M5 | 2016 | 560 | 15 | 223 |
| BMW | M6 | 2016 | 560 | 15 | 223 |
| 1 gt Cars is gtcars in gt. | |||||
| 2 Horsepower over 600 is a strong vehicle. | |||||
| 3 Fuel efficient! | |||||
| Source: gtcars is from the gt package. | |||||
Source:gtcars is from the {gt} package. |
|||||
Show the code
tbl_4 |>
  gt::data_color(
    columns = hp,
    method = "numeric",
    palette = c("firebrick", "dodgerblue4")
  ) |>
  gt::tab_header(
    title = "Heatmap",
    subtitle = gt::md("with `data_color()`.")
)| Heatmap1 | |||||
|---|---|---|---|---|---|
with data_color(). |
|||||
| Manufacturer | Model | Year | Horsepower2 |
Miles per Gallon
|
|
| City | Hwy | ||||
| Lamborghini | Aventador | 2015 | 700 | 11 | 18 |
| Lamborghini | Huracan | 2015 | 610 | 16 | 20 |
| Lamborghini | Gallardo | 2014 | 550 | 12 | 20 |
| BMW | 6-Series | 2016 | 315 | 20 | 303 |
| BMW | i8 | 2016 | 357 | 28 | 293 |
| BMW | M4 | 2016 | 425 | 17 | 243 |
| BMW | M5 | 2016 | 560 | 15 | 223 |
| BMW | M6 | 2016 | 560 | 15 | 223 |
| 1 gt Cars is gtcars in gt. | |||||
| 2 Horsepower over 600 is a strong vehicle. | |||||
| 3 Fuel efficient! | |||||
| Source: gtcars is from the gt package. | |||||
Show the code
tbl_4 |>
  gt::cols_add(powerful = hp > 600, .after = hp) |>
  gt::cols_add(
    powerful_color = if_else(powerful, "forestgreen", "firebrick")
  ) |>
  gt::cols_hide(powerful_color) |>
  gt::cols_label(powerful = "") |>
  gt::text_case_match(
    "TRUE" ~ fontawesome::fa("dumbbell"),
    "FALSE" ~ fontawesome::fa("frog"),
    .locations = gt::cells_body(columns = powerful)
  ) |>
  gt::tab_style(
    style = gt::cell_text(color = gt::from_column("powerful_color")),
    locations = gt::cells_body(columns = powerful)
  ) |>
  gt::tab_header(
    title = "Derive new cols, hide others",
    subtitle = gt::md("with `cols_add()` and `cols_hide()`")
)| Derive new cols, hide others1 | ||||||
|---|---|---|---|---|---|---|
with cols_add() and cols_hide() |
||||||
| Manufacturer | Model | Year | Horsepower2 |
Miles per Gallon
|
||
| City | Hwy | |||||
| Lamborghini | Aventador | 2015 | 700 | 11 | 18 | |
| Lamborghini | Huracan | 2015 | 610 | 16 | 20 | |
| Lamborghini | Gallardo | 2014 | 550 | 12 | 20 | |
| BMW | 6-Series | 2016 | 315 | 20 | 303 | |
| BMW | i8 | 2016 | 357 | 28 | 293 | |
| BMW | M4 | 2016 | 425 | 17 | 243 | |
| BMW | M5 | 2016 | 560 | 15 | 223 | |
| BMW | M6 | 2016 | 560 | 15 | 223 | |
| 1 gt Cars is gtcars in gt. | ||||||
| 2 Horsepower over 600 is a strong vehicle. | ||||||
| 3 Fuel efficient! | ||||||
| Source: gtcars is from the gt package. | ||||||
Show the code
spark_dat <- gt_cars_sample |> summarize(.by = mfr, spark = list(hp))

gt_cars_sample |>
  inner_join(spark_dat, by = "mfr") |>
  gt::gt() |>
  gtExtras::gt_plt_sparkline(column = spark) |>
  gt::tab_header(
    title = "Add Sparklines (and other plots)",
    subtitle = gt::md("with **{gtExtras}**.")
)| Add Sparklines (and other plots) | ||||||
|---|---|---|---|---|---|---|
| with {gtExtras}. | ||||||
| mfr | model | year | hp | mpg_c | mpg_h | spark |
| Lamborghini | Aventador | 2015 | 700 | 11 | 18 | |
| Lamborghini | Huracan | 2015 | 610 | 16 | 20 | |
| Lamborghini | Gallardo | 2014 | 550 | 12 | 20 | |
| BMW | 6-Series | 2016 | 315 | 20 | 30 | |
| BMW | i8 | 2016 | 357 | 28 | 29 | |
| BMW | M4 | 2016 | 425 | 17 | 24 | |
| BMW | M5 | 2016 | 560 | 15 | 22 | |
| BMW | M6 | 2016 | 560 | 15 | 22 | |
Show the code
tbl_4 |>
  gt::opt_interactive(
    page_size_default = 3
  ) |>
  gt::tab_header(
    title = "Make table Interactive",
    subtitle = gt::md("with `opt_interactive()`")
  )
Make table Interactive
with
opt_interactive()Source: gtcars is from the gt package.
1 gt Cars is gtcars in gt.
2 Horsepower over 600 is a strong vehicle.
3 Fuel efficient!
Takeaways
You now have the mental model and toolkit to create polished tables for 80% of real-world situations. We covered:
- Structure: Use stubs, row groups, and column spanners to organize data logically.
- Context. Use headers, footers, and footnotes to explain what readers are looking at.
- Style. Use colors, text formatting, and heat maps to draw attention to what matters.
From here:
- The {gt} documentation is comprehensive and you know the conceptual landscape well enough to navigate it.
- Explore the ecosystem: {gtSummary} for statistical summaries, *{gtExtras}** for plots and spark lines.